
Revision summary
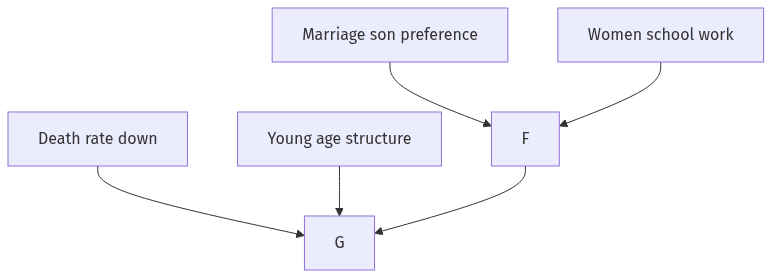
Demographic factors: falling mortality, delayed fertility decline, young age structure and momentum. Social factors: early marriage, son preference, class and region, women’s education and work. NFHS shows convergence, with remaining high-fertility pockets. NPP 2000, Mission Parivar Vikas and girls’ education are the humane policy line; Emergency coercion is the warning. Javed (2003) allowed two-child rules for panchayat office; the social cost is still debated.
Model answer
Copper italics in this answer — like this — are the key facts. Each one is unpacked in the Facts & figures rail.
Introduction
India’s population growth is the gap between births and deaths, plus a young age structure that keeps adding mothers even when each woman has fewer children. Demographic factors are those vital rates and age pyramids. Social factors are marriage, son preference, caste, class, religion as lived practice, and the state of women. They are not two separate engines.
Body
Demographic factors
Mortality fell from the mid-twentieth century through public health, antibiotics, smallpox eradication and later immunisation. Fertility fell later and unevenly. The crude birth rate stayed high while death rates dropped, producing the classic population explosion of the 1951–1991 censuses. A youthful age structure still adds numbers through population momentum even as the total fertility rate of many states sits near or below replacement (Kerala, Tamil Nadu, Andhra, later Bengal and others). High-fertility outliers remain in parts of the Hindi belt, though NFHS-5 showed those too declining.
Urbanisation, later female marriage where education rises, and contraception prevalence are counted as demographic because they change rates. Migration redistributes people (Kerala Gulf, Bihar to Delhi) but does not by itself raise national totals.
Social factors
Early and near-universal marriage historically kept fertility high. Son preference and the marriage squeeze sustain extra births and, where sex selection occurs, a skewed child sex ratio — a social fact measured demographically. Joint family and kin pressure, and the use of children as old-age security where pensions are thin, work in the same direction.
- Caste and class: poorer ST and some OBC groups show higher fertility in NFHS tables, largely through education and health access, not through a mystic “tribal fertility”. Muslim fertility has been higher in some rounds and is converging; Sachar treated this as development, not as a separate biology.
Women’s schooling, property and paid work are the strongest social brakes. Panchayat reservation for women, Beti Bachao Beti Padhao, POSHAN, Mission Parivar Vikas in high-fertility districts, and now a political language of supportive not coercive family planning after the memory of Emergency sterilisation, are the policy surface.
The National Population Policy 2000 set a TFR-2.1 goal. Several southern states now worry about ageing, not explosion. Any national “two-child norm” for panchayats or jobs, as some states have tried, collides with reproductive rights and with Javed v. State of Haryana (2003), where the Court allowed a two-child disqualification for panchayat office — a judgment still argued in gender and minority debates.
- Anthropology adds: fertility is household strategy. A land-poor household may want fewer children once school fees bite; a pastoral household may still want labour. Growth is therefore regionally social, not a single Indian rate.
Flow diagram
Conclusion
Death control without birth control produced growth; age structure prolongs it. Marriage, son preference, women’s schooling and class decide how fast fertility falls. Policy works when it is health and education, not panic.
Quick related
Students also ask
-
What are the identifying criteria for PVTGs in India? Examine their current status, nomenclature and distribution
Next question on this syllabus topic (2025 · Q8(c)). View answer →
-
Is religion the main cause of India’s growth?
No. Education, mortality decline and age structure explain far more. Religious differentials exist and are narrowing.
-
Has India finished its fertility transition?
National TFR is near replacement, but momentum, regional gaps and ageing in the south mean the story is now about distribution and care, not only growth.
Same topic · past papers
UPSC has asked this before
These previous-year questions sit on the same topic. Open one to practise the earlier ask.
-
2024 · Q4(c) · Anthropology GS 2 · 15 marks
What are the demographic challenges of India's changing population dynamics in the next 50 years?
More from this topic
Q4(b) · UPSC Mains 2026 · Anthropology GS 2 · 15 marks · Solution
Why have the classifications of Indian populations, based on somatometric and somatoscopic characteristics, failed to develop a common understanding of the population diversity?
Demographic profile of India
• Early classifications used body measurements (somatometry) and visual traits (somatoscopy) to group Indians into rigid racial categories. • These methods failed because physical traits are subjective, easily influenced by the environment, and overlap heavily across different groups. • Static racial models ignored India's indigenous evolution, long-term gene flow, and continuous biological variation. • Centuries of social mixing, migration, and endogamy created complex hybrid populations that defied pure typological grouping. • Modern DNA research proves there is deep genetic continuity beneath superficial physical differences across Indian groups. • Anthropology has now shifted away from outdated racial types toward dynamic studies of population genetics and linguistics.
Q8(c) · UPSC Mains 2025 · Anthropology GS 2 · 15 marks · Solution
What are the identifying criteria for PVTGs in India? Examine their current status, nomenclature and distribution
Demographic profile of India
PVTGs are a vulnerable subset of STs, about 75 groups, identified on pre-agricultural livelihood, lagging population and literacy. The name changed from Primitive Tribal Groups to drop a colonial adjective. Distribution: mainland scatters plus Andaman isolates with a separate contact ethic. PM-JANMAN, older CCD plans, FRA habitat rights and Niyamgiri are the status markers. Gaps: missed hamlets, standard housing, weak habitat titles.
Q3(b) · UPSC Mains 2025 · Anthropology GS 2 · 15 marks · Solution
Examine the environmental and biocultural factors influencing the health of tribals of India
Demographic profile of India
Environmental loads include malaria, mining dust, indoor smoke, iodine and water, plus displacement from dams and parks. Biocultural loads include shrinking forest diets, migration-TB, gender and fertility, medical pluralism and sickle-cell without counselling. Xaxa and the tribal health expert group asked for local cadres and disease-specific work, not a single plains protocol. PM-JANMAN, sickle-cell mission, Nikshay, POSHAN and Jal Jeevan matter only if hamlets are reached in their language. Forest rights are nutrition rights.