Revision summary
Fig. 1 items typically combine bar or pie readings on elderly population by gender and rural–urban residence; approach mirrors percentage change, share comparison, and dual-filter reading.
Model answer
Introduction
Age-structure diagrams require careful legend reading — rural vs urban stacks and male vs female components must not be merged before the stem allows.
Body
Source of Truth
- Peg: All numerical answers must be taken from Fig. 1 (population aged above 60 by gender and residence) in the official BPSC booklet; marks are awarded for correct computation, not for generic commentary alone.
- Peg: Show ratio answers in lowest terms unless the paper asks for a decimal; label gender or state filters before calculating percentages.
Reading the Figure
- Peg: Identify units (thousands/lakhs/%) on the vertical axis; note whether bars are stacked or grouped.
- Peg: Separate gender and residence dimensions before answering each sub-part.
Share and Comparison Questions
- Peg: Percentage share = component ÷ stated total × 100; for ‘highest/lowest’ compare shares, not raw height unless units equal.
- Peg: Urban vs rural elderly dependency comparisons should cite both absolute and relative figures when asked.
Growth and Difference Items
- Peg: Percentage change = (New − Old) ÷ Old × 100; difference items subtract after aligning categories.
- Peg: If two cohorts are compared, ensure both belong to the same residence category unless stem crosses them.
Policy Link (Brief)
- Peg: Optional closing line: ageing plains population (including Bihar’s outbound care migration) raises geriatric health and pension design issues — only after numerical parts are solved.
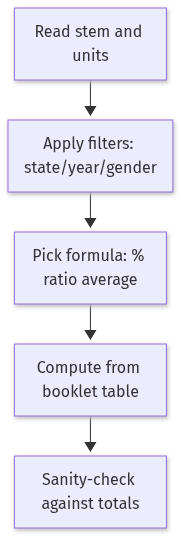
Flow diagram
Conclusion
Figure-based GS-I questions are scored on accurate transcription; draft a mini-table from the diagram before calculation to secure Section III marks.
Quick related
Students also ask
-
Write short notes on the following:
(a) The Indian Councils Act, 1861.
(b) Role of Bihar in the Quit India Movement.
(c) Santhal uprising.
(d) Patna Kalam painting.
(e) Art and Architecture of Mauryan Age.
Next question on this syllabus topic (2024 · Q1). View answer →
-
Where is the full Fig. 1 data?
In the official BPGS1 PDF on wrapexams media path for 2025; copy values before attempting arithmetic.
-
Do I need to draw the figure again?
Usually not unless asked; a small derived table in the answer sheet suffices for working.
More from this topic
Q7 · UPSC Mains 2025 · GS I · 36 marks · Solution
In respect of hospital data given in Table 1, answer the following questions. (Table in official booklet — July 2025 hospital outcome data by department and gender.) (a) Which department has highest percentage of female patients? (b) What is ratio of Neurology patients to Cardiology patients among male patients? (c) Which departments have more than one-fourth of the total admissions, respectively in each gender category? (d) Which department has highest ratio of specialized care to cured ratio for male and female combined group? (e) If one more female was admitted to specialized care and cured category each and one less male under cured category in the Cardiology department, then what would be the overall ratios of specialized care to cured under each gender? Or In respect of data from Fig. 1 for population aged above 60, answer the questions that follow. (Figure in official booklet.)
General Studies I
Method-focused WRAP for Section III Table 1: filters female share by department, male neurology-to-cardiology ratio, departments exceeding one-fourth admissions, specialised-care-to-cured ratios, and the stated counterfactual in cardiology — all computed strictly from the printed booklet.
Q6 · UPSC Mains 2025 · GS I · 38 marks · Solution
(a) In recent years, the Chhath festival has gained increasing global attention. Discuss the Social, cultural and economic impact of Chhath and its linkages with migration. Or (b) Bihar has emerged as the top-performing state in the country in the ‘Prime Minister Formalization Micro Food Processing Enterprises Upgradation’ (PMFME) Scheme. Analyse the potential PMFME towards contribution in the economic development of the Urban and Rural areas in Bihar.
General Studies I
Chhath is a lunar festival venerating Surya and Chhathi Maiya, concentrated in Bihar–Purvanchal; diaspora celebration, reverse migration, and local informal economy effects make it a transnational cultural asset with measurable remittance and tourism spillovers.
Q5 · UPSC Mains 2025 · GS I · 38 marks · Solution
(a) Discuss the India-European Free Trade Association (EFTA) Trade and Economic Partnership Agreement (TEPA), signed on 10 March 2024, which came into effect on 1 October 2025. Also, explain the economic and strategic implications of India-EU relations. Or (b) The UN Sustainable Development Goals (SDGs), also known as the Global Goals, have been in effect for ten years since their adoption in September 2015. Examine India's progress and challenges in achieving the United Nations' Sustainable Development Goals.
General Studies I
TEPA with Iceland, Liechtenstein, Norway, and Switzerland trades market access for a binding USD 100 billion investment and jobs pledge over 15 years, while India–EU ties pivot on FTA talks, green partnership, and strategic autonomy amid China–Russia stress.