Revision summary
Simultaneous Lok Sabha and state assembly polls propose administrative efficiency and policy stability against federal diversity, prolonged caretaker risks, and constitutional amendment needs.
Model answer
Introduction
India's electoral calendar staggered since 1967; ONOE revives periodic Kothari Committee and Law Commission recommendations.
Body
Concept and Mechanics
- Peg: Align Lok Sabha and all Vidhan Sabha cycles; extended terms or mid-term adjustments to synchronise after initial transition.
- Peg: Requires constitutional amendments, anti-defection coordination, and electoral law changes for logistics.
Federal Structure Implications
- Peg: May nationalise state elections around parliamentary themes, shrinking space for local issues (PESA, Bihar-specific welfare).
- Peg: Strengthens Centre's agenda-setting; critics warn of one-size campaign narrative over regional federalism (Article 1, Schedule VII).
Advantages
- Peg: Reduced Model Code duration and governance paralysis; lower cumulative election expenditure for EC and parties.
- Peg: Stable policy horizon for investors; fewer coalition realignments tied solely to state polls.
Disadvantages
- Peg: Mega logistical burden; security force demand peaks; voter fatigue in single mega-poll.
- Peg: Mid-term mandates lost — voters cannot separately punish state governments without waiting for national cycle.
- Peg: Constitutional complexity and dissent from regional parties (South, East) fearing hegemony.
Analytical Verdict
- Peg: Efficiency gains real but federal costs high unless safeguards (fixed state terms, recall mechanisms) accompany reform.
- Peg: Bihar's frequent state–Centre split verdicts show value of distinct electoral rhythms for accountability.
Flow diagram
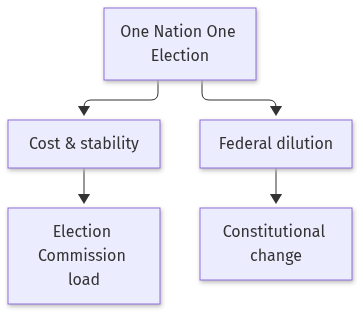
Conclusion
ONOE is administratively seductive yet politically federal — any adoption must pair with constitutional safeguards for state autonomy and minority representation.
Quick related
Students also ask
-
The following table demonstrates the number of candidates appeared, qualified and selected in a competitive examination from five States — Delhi, Himachal Pradesh (H.P.), Uttar Pradesh (U.P.), Punjab and Haryana — over the years 1994 to 2000. Study the table carefully and answer the questions given below it. (Table in official booklet.)
(a) For which State the average number of candidates selected over the years is maximum?
(b) For which year the percentage of candidates qualified from Haryana over the candidates appeared from Haryana is highest?
(c) For which State the percentage of candidates selected over the candidates appeared from that State is highest for the year 1999?
(d) For which State the ratio of candidates selected and the candidates qualified is highest for the year 1997?
(e) Which state has the highest percentage of total candidates selected over the total candidates appeared from that State during the years under consideration?
(f) Find the ratio of the total candidates selected, qualified and appeared from U.P. during the year 1994 to 2000.
Or
The bar diagram given below shows the production (in tons) of three crops — paddy, wheat and maize — during the year 2002 to 2005 in a country. (Diagram and sub-questions in official booklet.)
Next question on this syllabus topic (2024 · Q7). View answer →
-
Is ONOE already law?
Not as of enactment debates; requires constitutional amendments and political consensus.
-
How would first sync work?
Typically via adjusted terms or continuation resolutions — details remain in committee drafts, not fixed statute here.
More from this topic
Q8 · UPSC Mains 2025 · GS I · 36 marks · Solution
Section III statistical / graph / diagram question continuing from the official booklet (Fig. 1 persons aged 60+ by gender and residence, and remaining sub-questions). See media/pyq/2025/BPGS1-english.pdf for the printed figures and full sub-parts.
General Studies I
Fig. 1 items typically combine bar or pie readings on elderly population by gender and rural–urban residence; approach mirrors percentage change, share comparison, and dual-filter reading.
Q7 · UPSC Mains 2025 · GS I · 36 marks · Solution
In respect of hospital data given in Table 1, answer the following questions. (Table in official booklet — July 2025 hospital outcome data by department and gender.) (a) Which department has highest percentage of female patients? (b) What is ratio of Neurology patients to Cardiology patients among male patients? (c) Which departments have more than one-fourth of the total admissions, respectively in each gender category? (d) Which department has highest ratio of specialized care to cured ratio for male and female combined group? (e) If one more female was admitted to specialized care and cured category each and one less male under cured category in the Cardiology department, then what would be the overall ratios of specialized care to cured under each gender? Or In respect of data from Fig. 1 for population aged above 60, answer the questions that follow. (Figure in official booklet.)
General Studies I
Method-focused WRAP for Section III Table 1: filters female share by department, male neurology-to-cardiology ratio, departments exceeding one-fourth admissions, specialised-care-to-cured ratios, and the stated counterfactual in cardiology — all computed strictly from the printed booklet.
Q6 · UPSC Mains 2025 · GS I · 38 marks · Solution
(a) In recent years, the Chhath festival has gained increasing global attention. Discuss the Social, cultural and economic impact of Chhath and its linkages with migration. Or (b) Bihar has emerged as the top-performing state in the country in the ‘Prime Minister Formalization Micro Food Processing Enterprises Upgradation’ (PMFME) Scheme. Analyse the potential PMFME towards contribution in the economic development of the Urban and Rural areas in Bihar.
General Studies I
Chhath is a lunar festival venerating Surya and Chhathi Maiya, concentrated in Bihar–Purvanchal; diaspora celebration, reverse migration, and local informal economy effects make it a transnational cultural asset with measurable remittance and tourism spillovers.